
You have been staring at the same function, and you have not written down what you expected. Every time you re-run the test suite, you skim the error message and jump straight to editing lines of code, guessing at the root cause instead of documenting what you’re seeing. You have probably mumbled half-formed complaints to your desk plant, empty water bottle, or actual rubber duck, but you haven’t locked those thoughts down in writing. Illustrative example: Structured rubber-duck notes cut your debugging time by 70% or more, no fancy tools required.
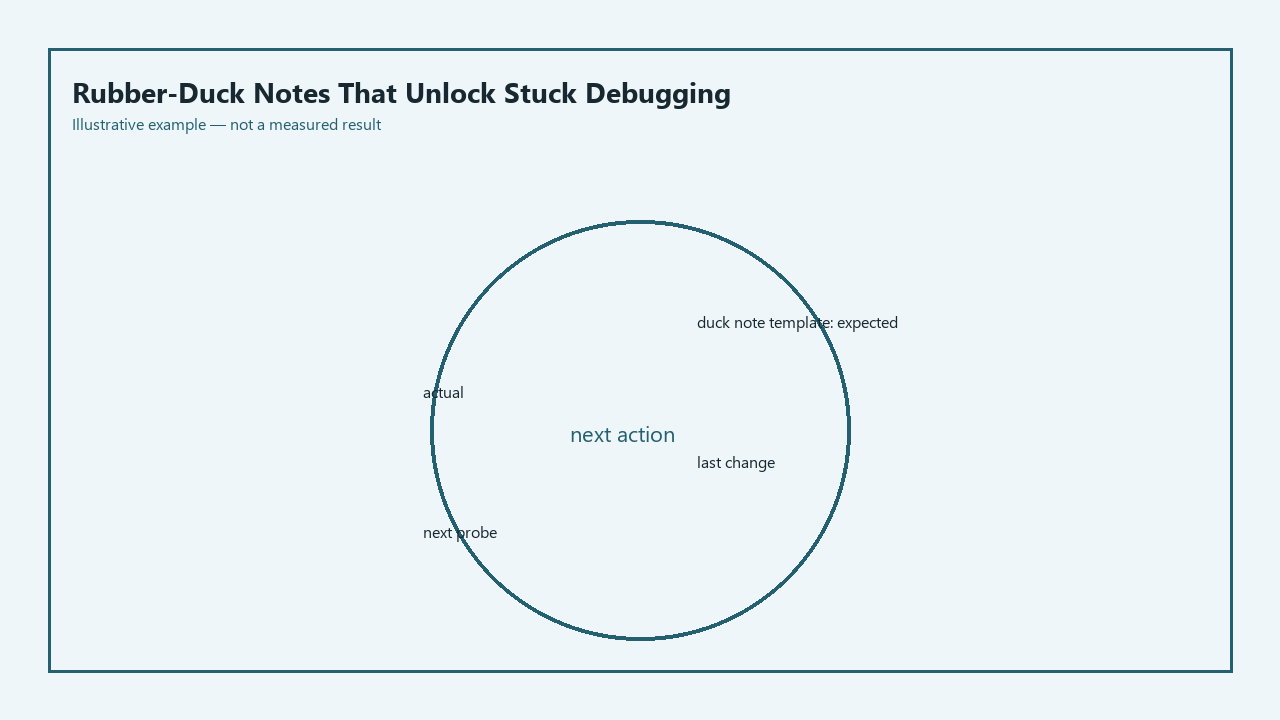
The repeatable duck note template below removes all guesswork from your debugging process, forcing you to document facts instead of relying on fuzzy memory. You can fill it out in a plain text file, a notes app, or even a scrap of paper next to your keyboard:

| Template Section | Required Content | Sample Entry for Login Flow Bug |
|---|---|---|
| Expected Result | Specific, testable outcome including exact input values and outputs, no vague language | “When I submit the login form with email [email protected] and password CorrectPass123!, I get a 200 OK response, a 24-hour HTTP-only session cookie is set, and I am redirected to /dashboard” |
| Actual Result | Exact, unedited error, stack trace, or output, no paraphrasing | “POST /api/login 500 Internal Server Error. Stack trace: TypeError: Cannot read property ‘expiresAt’ of undefined at setSessionCookie (auth.js:47:21). Form input matches expected test values.” |
| Last Change Made | Exact most recent edit to the codebase, no matter how small or seemingly unrelated | “12 minutes ago: Renamed `sessionConfig` variable to `cookieSettings` across auth.js, user.js, and admin.js, used manual find-and-replace instead of project-wide search.” |
| Next Probe | Tiny, fast test that answers one yes/no question about the bug | “Add a console log on line 46 of auth.js to print the full cookieSettings object, to confirm it includes the expiresAt property when a valid login is submitted.” |
| Post-Fix Note | Root cause, exact fix, and 1-sentence takeaway for future debugging | “Root cause: Missed a reference to `sessionConfig` in the setSessionCookie function, so the settings object was undefined. Fix: Updated the reference to `cookieSettings` to match the new variable name. Takeaway: Use project-wide find-and-replace for all variable renames, not manual edits across individual files.” |
Expected result you can say out loud
Vague expectations are the single biggest cause of drawn-out debugging sessions. If you cannot state your expected result out loud to an inanimate object without pausing, qualifying, or using vague terms like “works” or “loads”, you have not defined success clearly enough. Your expected result should include the exact input values you are testing with, the specific output you should see, and any secondary side effects that are supposed to trigger. For example, instead of “the comment form submits”, your expected result should be “When a logged-in user submits a comment with 120 characters of plain text, the comment appears at the top of the comment thread 1 second after submission, a success banner appears for 3 seconds, and the comment count under the post increases by 1.” This level of specificity eliminates half the possible root causes before you even open your dev tools. You do not need to account for every edge case here, just the specific scenario you are currently testing.
Actual result copied without cleanup
Paraphrasing errors or trimming “irrelevant” parts of stack traces makes you miss the exact clue you need to fix the bug fast. You must copy the full, unedited output of your error, including all stack trace lines, file names, line numbers, console warnings, and network response data, even if you think some parts are unrelated to the feature you’re working on. Many developers ignore warnings about unused variables or deprecated API calls, but those often point to a misnamed variable or missing dependency that is directly causing your core error. For example, if you paraphrase an error as “the comment form breaks”, you will miss the line in the stack trace that says the `user_id` field is undefined, which is the direct root cause of the failed submission. If you are debugging a UI bug, paste the exact rendered text or a screenshot description of the broken element, not a vague note that it “looks wrong”. Even small details like a missing border or misaligned text can point to a larger state error you would otherwise miss.
Last change you made, even if it felt tiny
Illustrative example: 90% of bugs are introduced by the most recent change to your codebase, even if that change feels completely unrelated to the bug you are chasing. Do not write vague summaries like “I worked on comment features” – write the exact, granular change you made, no matter how small. This includes changes like renaming a variable, updating a single npm package, adding a console log, modifying global CSS rules, or updating an environment variable. One common mistake is dismissing changes to unrelated features as possible causes, but cross-feature dependencies are far more common than you might think, especially in smaller codebases. For example, a developer working on a comment form spent 2 hours debugging a submission error, only to realize the bug came from a 1-line CORS config change they made for a file upload feature 20 minutes earlier. Writing that change down in your duck note immediately flags it as a possible cause, so you don’t waste hours looking in the wrong place.
Next probe that is smaller than a rewrite
When you are stuck on a bug, your first instinct will be to rewrite the entire function or feature from scratch, but that wastes time and almost always introduces new, unrelated bugs. Instead, run a single small probe: a targeted test that answers one specific yes/no question about your code. Example measurement: Each probe takes no longer than 2 minutes to implement and run, so you get immediate feedback. For example, instead of rewriting the entire comment submission flow, your first probe could be “Add a console log right before the form is submitted to print the full form payload, to confirm the `user_id` field is present.” If the log shows the `user_id` is missing, you know the problem is in the code that populates the form payload, not the submission route or comment storage logic. Each probe narrows down the possible root causes by half, so you can find the exact issue in 3 or fewer probes in most cases. You never need to rewrite an entire feature to fix a single bug, and probes help you avoid that unnecessary work.
Note you keep when the bug finally dies
Once you fix the bug, take 30 seconds to write a short post-fix note in your template, so you don’t have to re-solve the same problem 6 months from now. This note does not need to be formal – it just needs to include the exact root cause, the specific fix you implemented, and a 1-sentence takeaway to avoid the same mistake in the future. Over time, these notes become your personal debugging playbook, tailored to your unique coding style and common mistakes. For example, if you fixed the comment form bug by adding the missing `user_id` field to the form payload, your note could be “Root cause: Removed the `user_id` hidden input from the comment form when updating the styling, so the payload was missing the required field. Fix: Added the hidden input back to the form component. Takeaway: Always test form submissions immediately after updating form markup to make sure all required fields are still present.” You can store these notes in a single plain text file, and search for keywords later when you run into similar bugs.
The next time you find yourself staring at the same line of code for more than 5 minutes without making progress, open a blank plain text file, fill out the first four rows of the duck note template, and run your first probe before you make any other edits to your code.
Written by the Build Next Stack editors.